The whole reason for this gathering is to sort thru the clutter,corruption, lies, risk on, aglo driven, liquidity lacking, insolvent, bankrupt, rumor driven bullshit market. What I want is a healthy discussion from both bulls and bears on where the markets may be headed and why. I know it is my job here to do the calling and all that, but I want to hear your thoughts.
I know that all we will discuss will be pure speculation. One thing I believe most of us know is that this all ends horribly. The question is how long can they hold out? How will they hold out? Can the markets set a higher high? Show your charts, links and whatever you have to back up your thoughts.
If some of you would like to discuss preparedness as well, please feel free. This will be a comment driven event with many tangents. I have no idea how disqus will handle the pressure (if we get a good turn out), but deal with it.
Showing posts with label shanky. Show all posts
Showing posts with label shanky. Show all posts
Sunday, November 6, 2011
Tuesday, September 13, 2011
TYP 60m Wedging Into Support?
Here is a Think or Swim 60m chart of TYP Direvion Technology Bear 3x Shares (or in English - triple short tech bear ETF). First I will say these things are notoriously dangerous and will rip holes in your portfolio where money will pour not leak out if you are not careful with them. Always have a plan for each trade and always use stops.
Black diagonals are either an ugly channel or a large rising wedge.
There is a gap from 18 to 18.64 that needs to be noted.
Note the blue falling wedge.
Red horizontal support at 21.57.
At this time it looks like the blue wedge is in play, but the black formation was there first and may be the driver here. If so, look for first support at the black support diagonal near 22.22. If that goes you have to consider the blue wedge as the driver now and any move thru the red support line at 21.57 should result in a test of the lower blue support at or near the 20.20 area.

STB Morning Post 09/13/11
Not much to say other than China saved the day yesterday (again). It seems that you can always count on intervention of some sort to save the day (till you can't). Bottom line is they will continue to stick save till they can't. As noted on STB a few months back, it appears that the power brokers in governments around the world are tired of bailing out the banks.
The bankers have bled the system and their puppet politicians as much as possible (times two). The governmental representatives have gained nothing politically as their voter base has become increasingly dissatisfied with their performance. On the other hand, you would assume that the money flowing into their coffers from these special interests is coming in at an astounding rate. Quite the trade off, sacrifice your country and political career while you go for the big cash grab. How American!
I think they are thru throwing good money after bad. I think the politicians are actually beginning to see the light. After throwing a DISCLOSED $4 trillion at the problem (not the actual $30 trillion it took to bail out the world) and getting nothing out of it, maybe, just maybe they are growing a set large enough to take on the banks and the default issues that are coming.
I hope you all like the new look old blog. STB.com is still down and I am actually considering staying here at this point till the new blog is up and running. Comments and suggestions are always welcome. What you like and don't like I need to know so it can be incorporated into the new blog. Don't tell me after the fact, you need to tell me now.
Minis this morning have made quite the recovery (not sure who came in with the big stick (or wantons filled with dollars as sellputs put it yesterday). All it takes is a rumor to move the DOW 100 points either way in minutes. Thus, this is a dangerous playground to bring your ball to. Remember to have a trading plan for each trade and to always use stops.
Minis - yellow channel support being backtested. the blue triangle backtest is just above. 1161 (price at now) is first resistance and then 1178. Those can get run thru with the right "solution" today. Inversely 1123 is the magic number for severe downside action continuation. Bottom line is the markets are consolidating at these levels and remain range bound. Note - I adjusted the channel a bit this morning to what should be a more accurate representation of the channel capturing the last low at 1138 - where it was below the support diagonal yesterday. This is an allowable thing to do and is sometimes necessary when working with charts. STB always reviews his trendline positions and if adjustments are necessary, then I make them (and you should as well).

Friday, September 9, 2011
Morning post (in Exile) 09/09/11
How bout that stealth debt ceiling increase last night? Holy shit. Welcome to the 15 trillion level and 100% debt to GDP - the end is near folks. I do believe they could fix this problem very easily, but it would cost us our military might. You just cut the defense budget in half and poof there will be plenty of money. Sorry - not willing to do that. Would much rather starve than be the small dog on this big rock.
Hell, even if they did that they would then expand the entitlement system till the system failed again. It is all so stupid. We got a bunch of lazy mofos/parasites that have been living off the host for too long. OK, HS science class - what happens when parasites overwhelm and wear out their welcome on their host? Host dies. that is where we are as a nation.


Day Two in Exile - 09/09/11
Well, I did get in STB last night for a bit. If you don't get timed out and have all the time in the world the page will load. Takes close to 5m to load a page, so for me to do a post last night just to get into the add a post page took close to 20m. Not acceptable, so when I got in I railed a bit on the host register.com for their severe lack of communication and failing customer service skills. It was not a full rant. Their prior good grades and my good nature have kept the STB dogs at bay - for now.
Interesting side note - I started surfing on chrome about three weeks ago. My daily infection level went to ZERO. Surfed on firefox yesterday for some reason and got 122 pieces of crap on my machine.
Let me thank each of you for making the quick transition yesterday. It is always a nerve racking thing when a blogger moves or is disrupted, wondering how many readers will get lost or simply go elsewhere. I am tickled pink at the results of the team. I bet whoever it is that is trying to bring STB down is quite peeved right now. This is their 4th hack attempt and to see the results from yesterday we all sent a big FUCK YOU to the hacker.
Thursday, September 8, 2011
EMERGENCY POST 09/08/11
This is an emergency post since either host is down or I have been hacked again.
More to come later.
Wow - got to figure my way around blogger again - Obviously i have a lot of other stuff to do this AM figuring out what's up with the new blog so this will be brief. Do me a favor and leave a comment so I know you are here.
Jobs were worse than expected. Futures dipped and immediately recovered.
1m lower VWAP got abused but was retaken in the next minute. 1m200ma 1191. VWAP 1190. Upper VWAP band 1196 - Lower 1184. About 7:45 minis broke back below the VWAP. I would expect it to stay there for the rest of the day.
Yesterday STB gave the 15m 13/34 as a sell - looks like it will work. This was a TA sell and not a 13/34 cross. This is possibly only a scalp or corrective move before more strength so be careful trading it.

Wednesday, April 14, 2010
I Think You Have To Get Ready For A Turn
I'm just saying, you know how stupid this sounds, like the market could actually turn. LMAO. With that thought in mind I present the following.
CPC is getting near the extremes that brought the last big sell off. It is not there yet and we may need a little pop to get us there, but it is in the potential reversal zone. Last time it was down here we got a major move.
 Daily SPX - OK, price is above the daily BB. It is just under resistance. The red wedge is ending. The BB is pinching price into support. The BB may be vertical at this point. The BB width is very narrow indicating volatility. It has been overbought for an extended period.
 SPX weekly - I have been bringing you this chart with targets since October. I have cautioned that this rally will be over when the RSI crosses that red support line. With RSI finally over 80 one would think that would be enough. I will be truly amazed if it crosses the green target zone which contains the 200ma at 1224, the gap, the 61.8% retracement at 1230 and C=A at 1214. In my opinion this last push that got the market thru the bear market upper trendline is the blow off top suckers rally.

I'm not saying go short the market. I'm saying this should be a major turning point if things were "normal". I will continue to play my SDS and SSO up and down on the 30m S Sto crosses on SPX. They can ramp this SOB to the moon for all I care, but if this technical intersection on the daily chart does not produce a reversal I'll be amazed (yes, even more than I already am). GL!
CPC is getting near the extremes that brought the last big sell off. It is not there yet and we may need a little pop to get us there, but it is in the potential reversal zone. Last time it was down here we got a major move.


I'm not saying go short the market. I'm saying this should be a major turning point if things were "normal". I will continue to play my SDS and SSO up and down on the 30m S Sto crosses on SPX. They can ramp this SOB to the moon for all I care, but if this technical intersection on the daily chart does not produce a reversal I'll be amazed (yes, even more than I already am). GL!
Wednesday, March 10, 2010
Morning Protest
I'm slightly pissed this am. Well, does the second run on a BS rumor in a week really surprise you? Yup, it happened again. The market goes nuts on "rumors". Friggin Rumors? That's right. We've now entered a state where all it takes is for some floor trader to break wind and the market reacts like someone lit a fire under it. ZH brings you the details in their own unique way in The Scamming Of Investors Continues, Courtesy Of The Rumormill Formerly Known As The Equity Market. I'll put it this way, if they have to resort to possibly releasing speculative information (obviously information from reliable sources to people who are in the right place to move the market) then they are in deep trouble. Have the PPT's pockets run dry? The real problem is the SEC's lack of concern and the fact that this occurs so easily. Folks, this is the BS your markets have become.
On to the markets - Minis flat, markets overbought (that is a slight joke cause you know that I think every gain since April is fraudulent) and now markets are capable of a rumor driven ramp job at any moment to benefit the banksters as they have gone from taking cash out the back door on hand trucks concealed in some way to simply loading pallets on forklifts and taking it out the front door (this is your money by the way in the form of future tax liabilities).
After the move yesterday, I'm not all that inspired to give any sort of analysis. Why not just title my post - Morning Post - Another Ramp Job Today and be done with it? This shit is gonna bite them in the ass. Sadly, it is gonna bite you and me in the ass even worse when it all ends.
In protest of the government's (to many to list here) problems and inability to regulate anything I am not doing an analysis this am. Why should I? Isn't it painfully obvious that they know the market is bogus and are pulling out every stop to keep the levitation act going. Every BS move like this is a PUMP designed to suck in more of your money so they can DUMP. This is a suck job that Jenna Jameson would be proud of, yet sadly the benefits are not nearly comparable.
If you would like to see my charts go to the link to my chartbook on the right or click HERE.
Yes, I shorted (very lightly) late yesterday and was bold enough to swing it. FAZ and SDS. I will not stay around if they drop one cent under the purchase price.
It is beyond time to get active and do something to wake the sheeple up. Get active. Spread the word. Talk it up. Send emails with links to articles (or this blog, Mish, Zero Hedge, Denninger, Alex Jones - All links on the right in the blogroll). Let others know what is happening. Now is the time to be mad as hell while we may possibly still have a chance.
GL, you will need it.
Last night I included "Stop the Health care Takeover!" Petition to the U.S. Congress. Mish posted this last night -Pelosi: We have to pass the health care bill so that you can find out what is in it - you have to hear it to believe it. This shit has to stop.
Tuesday, March 2, 2010
UNG - Dead Cat Bounce Or Worse?
I ususally avoid the politics and some of the more detailed nuances surrounding the UNG trade for good reasons. 1) The forward contracts for UNG that drive price movements, and if a contango scenario exists that can not be overcome nothing good will come of it (see chart below) 2) Politics are brutal and the manipulation of pricing is possible and unfair (based on the stronger pull in Washington). 3) Supply/Demand reality versus fictional truths. 4) There is so much Natgas in the earth scarcity will never be an issue thus keeping prices low.
Here is the most recent Weekly Update from EIA. If you believe the EIA numbers (I don't), you can find all the governments info on Natgas HERE. I also suggest that you learn more about UNG HERE, cause you need to understand the nuances of the ETF before you invest. I think the "roll dates" are very important, and you can learn more about them HERE. My favorite disclaimer from the site, " These risks could result in large fluctuations in the price of UNG’s units. An investor could lose all or substantially all of his/her investment." I think those unfortunate ones that bout it in the $60's agree with that statement.
I know one thing, I believe that Natgas is a large part of America's energy independence and can provide a more earth friendly option to the other two in many cases. Sadly big oil and coal are not ready to allow the new comer into the game. A post by Madhedgefundtrader on Zero Hedge Coal Lobbyists Are Taking a Hatchet to the Natural Gas Industry drives some of these point home. "Their mission is to render toothless Cap & Trade legislation, block subsidies for natural gas which both parties seem to agree on, dilute environmental legislation, and promote the myth that the whole global warming thing is nothing more than a leftist hoax, thus keeping hands off King Coal."
So you have Natgas fighting an uphill battle on multiple fronts. I think that price proves these points. I do not see demand growing for Natgas in the near future. If anything I see if being flat to down based purely on my economic assumption that things are gonna stink for a long time as this depression draws out or enters what I think will be a double dip. I have read forecasts that see the price of Natgas going back to test the $2.40 lowas seen last August (UNG IS dead cat bouncing - /NG has a long way to go yet).

Looking at a chart comparing Natgas and Oil - Natgas re-entered the LT channel up after the drastic fall and is now backtesting the lower channel line. Will it find support here or will it revisit the $2.62 level? The indicators on this monthly chart don't look healthy. RSI is trending down. MACD hist is flat. S Sto and CCI appear to be rolling over as well. Yes, there could be some more pop in this corrective according to the charts, but I don't see it. The main thing you need to notice is the LT relationship to the price of oil. Will that correct and how will it correct? I think oil is coming down to meet NG.
Comparing Natgas to UNG this chart shows another glaring gap. OK, so what happened to UNG as compared to Oil and Natgas. Why the heck did it not rise like it was supposed to with the other two? Shouldn't it catch up? Well you see there was a massive contango issue. The spot price was near $2 and the Futures were near $5 and, kapow, UNG got hosed. Equilibrium did not make it that month. The spot price only got up to near $3 and that was all she wrote. Now it trades in backwardation where the futures are less than the spot now. No, it should not catch up theoretically. Give UNG a call and speak to an analyst if you like. They are there to help if you need it.


So, what technically does UNG have in store? Here is a daily chart of UNG. Double bottom, check! Falling wedge, check! At a NT support line, check! Indicators on the 30 and 60m with divergences, check! Daily indicators oversold, check! That is a lot of checks! I see near term oversold conditions that should lead to a pop, but not a big one. $9.50 max at this time is all I am willing to go. I also expect more downside. See the box with the ? in it? I first introduced that box in my UNG Popping post back on December 17th (I'll be adjusting it after this post). In that post I also gave you the "watch for hist to turn" note on the MACD hist as a good topping point. Not bad if you ask me. I suggest you look at my weekly UNG chart here and take a good look at the 20ma ($9.74 now) that has been acting like a lid on price. So, after we get some sort of correction that should begin in the next week or so, look for more weakness.
Sorry, but my bearish stance on UNG continues (and it will remain for probably another year if not longer - barring inflation). Bottom line is over supply and horrible economic conditions should dominate the market for the foreseeable future. Don't be fooled by short term pops in the economy. Sure NG may get a pop from all the heating going on in the NE right now, but with 30% usage from consumers and the other 70% from manufacturing and production do you think it will be meaningful? Winter is ending. They have shut down extraction facilities and supply is still near capacity. When the economy truly begins to recover (LOL, my regular readers know how I feel about that) so will UNG. Those hoping for a 6 handle on UNG again can fhugeddaboutit unless we have a hyperinflationary situation that drives commodities thru the roof (I give this a good probability down the road). Those looking for a NT pop, be patient it will come soon. $9.50 target.
Watch the 60m chart and look for price to crack the 20ma and for the RSI's to crack the downtrend lines. I'd also look for some sort of reversal candle on the daily chart. Keep those stops tight and let the trade come to you.
GL!
Saturday, January 30, 2010
Cause AGirlieGirl Wanted It
No - not me. She did not want me darn it.
I added some tunes. I did not put on autoplay, so you get to control the action. I will gladly take requests so leave them in the comments section or email.
Hell, we may as well enjoy the ride down as much as possible.
Enjoy!
I added some tunes. I did not put on autoplay, so you get to control the action. I will gladly take requests so leave them in the comments section or email.
Hell, we may as well enjoy the ride down as much as possible.
Enjoy!
Thursday, December 10, 2009
Morning Post
Another day in paradise! Leave it to ZH to bring up the obvious and thank them for allowing us to be able to see the forest. In the post Citigroup: KIA'd I got the real understanding of what I believe is the beginning (or potential escalation) of financial terrorism. This is where the big boys play ball and it is a game that is not televised for the world to see. It is a rare glimpse into the war of global politics. What I came away with is the simple fact that CITI is one withdrawal away from doom. I won't comment any more now, but read the post and then digest the ramifications.
Isn't this volatility GREAT!

/ES 60m daily - Had to go daily for the most accurate presentation of the LT tendlines. The blues P2 (bull market rising wedge) has been violated. The green falling wedge formed over the past several days fell to the 1085 support and appears now to possibly want to reverse as RSI bounces off of the 50 line. I'm thinking the range will be between the upper red resistance line and the lower green support line thru the end of the year. Exciting!

SPX 30m - This time frame is just to emphasize the range bound market. Does it go to the top again here? I do not think so, but it could easily. The 60m SPX indicators have bottomed and are turning. The dailys are continuing their long walk down setting a massive divergence to price that should be like a uge storm cloud coming over the horizon. With the Daily RSI at 50 and the 60m bottoming, maybe it is time for some sort of a pop here.The dollar has some room to breathe and even though the correlation has gone away some, it has not totally left the building.

Gold daily - Is it close to bottoming? Following S Sto I would say there may be a shot at an entry point for a trade soon. The big question is will this be a major or minor bottom and for those of you that want to get in need to make a decision? I personally think there is further downside, but do not want to miss any opportunity to get in in case I am wrong, so at this next low I will make a purchase (10% position) in GLD and will have to decide on the stop loss I am willing to bear (I am planning on holding LT, but am also willing to trade to get the best entry). As I have been discussing I will continue to DCA into gold on weakness.
Remember you can get all of my Stockcharts charts on a 20m delay at my link on the right. Use the drop down bx just above the chart's top RH corner.
GL out there today. It should be really exciting! (LOL)
Happy holidays.
Thursday, November 19, 2009
Morning Post
Oh lawdy, look at that DXY run. The only question is at which trendline does it stop? We have had 8 days in the blue box on my SPX daily chart and the avg top has taken 7 to 9 days. I mentioned yesterday that gold was toppy. That last hourly bullish candle on the 60m yesterday that fooled most will be gobbled up at the open this am by some gapage down. Somewhere near 1065 on the minis and the SPX is what I am seeing for now. That number will have to be refined, but it is what I see now. Note the dollar climbs fast and falls slow.

e-mini 60m - Breaking trendline and falling off of resistance. the only caution i see is the 60m indicators are bottoming while the dailys are topping. the daily RSI just topped its divergence trendline and is reversing south now and it appears barring a whipsaw a bear cross on S Sto will happen today.

$DXY 60m - How bout that pop last night. Someone almost called the dxy breakout yesterday to the minute, not sure who that was? Which trendline does it stop at pink or yellow? Based on the indicators of the major indexes I'm guessing yellow as they let the dollar out to run in the yard before putting it back in the dog house.Note again the rapid climbs and the slow falls in the swings.

SPX daily - Will the blue box theory hold? MACD hist has turned (again) and RSI appears weak. S Sto is embedded and at top range levels.

EUR/JPY - this chart needs to be seen. Sho looks like a pop is in order if you ask me. If the green and yellow TL support crack then the channel is toast and the fall begins.I almost want to call this the end of a B wave of a LARGE ABC corrective. If I am right it tops in the 152 to 155 range.When this puppy hits the upper trendline Mr. Toppy will be in the house IMO.

EUR/USD weekly - The weekly chart emphasizes just how overbought and tired this trade is. The green tendlines are Fib Fans that work really well on this chart, so $1.40 would be the first stop when the fall starts.
I plan on cranking up the shorts on SDS and SRS to 100% after the open at the best entry point I can find. The average fall has been 40 to 60 points and then a two to three day bottoming process. Why not fall to the lower blue trendline on the minis?
Could a top be in? Yes, but I do not think so. This is the first place I would be willing to say TOP. I think this is the beginning of a 3 down before the final 5 up of P2.
Corker rocks.
Updates -
Gold- Did someone say gold was toppy yesterday? Hmmmmm? Hmmmmm?
UNG - Gonna get stopped out this am as new lows get set. You do not want to know where I think it can go from here.
Oh - did anyone notice how that 500k jobs number was just briefly mentioned and is now just a ho hum subject. Just ignore tha man behind the curtain. This should be front page news that we should be raising hall about, but we all know now that the government is not doing a damn thing but to prop up the market and the TBTF's and could care less about job creation.
Wednesday, November 18, 2009
Morning Post
OK, tough call time. I think this is 5 of 1 up and 1115 is the target for the top, but with the news this morning I think 2 or 4 down is now here. I do not think a top is near here (although minis are battling with the top bear market trendline) for many reasons, number one being they are still forcing people into equities for return and a rate raise won't come for a while. The markets are the only game in town. This goes against so many things in place IMO. The dollar is going to have to hit some unimaginable numbers to create further strength, OR does the dislocation of the dollar and the markets begin soon signifying the irrational exuberance in the markets.
I think gold is going to top temporarily this week.
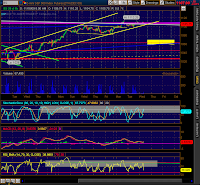
E - minis 60 m - Battle with top trendlines continues. See that yellow box? That is the 50 to 61% retracement zone and it runs nicely with the 1062 support and the lower (blue) P2 support line.

DXY 60m - Is it in a descending triangle? HERE is one of my big questions. If the minis are in a 2 down bouncing off of strong resistance it appears it will take a 3 (third wave) up to bust that. Do you see a three driver in the dollar chart? It is at support and wedging. The floor in the dollar has me a little timid in calling for a impulsive 3 up. Does the market and the dollar begin their dislocation soon?

SPX chart - The style is called Sunset and I will use this weekly chart to call the sun setting one the SPX. We're missing the divergence in CCI and a larger divergence in RSI IMO.

SPX 60m - Looks like a completed 5 waves up, and the divergences are there. 1081 to 1061 is the target range at this time. That will be refined as we go.

Index comparison chart - Art mentioned the Russell 2000 this am and stole my thunder. Can you say lag?

SPX daily - Day 7 in the blue box - Look for MACD hist to turn today (I thought it would turn yesterday.
UPDATES -
UNG - Pulling back. 60m chart looks bad, but the dailys look ok for now. Be careful and set your stops.
EUR/JPY- Should drive down to support at 131.
EUR/USD -Between support and resistance topping.
Gold - I think it is going to have a small pullback very soon. I'll do a post.
Oil - forming a base for a further push higher IMO.
Look for updates during the day.
If you are reading this post on another feed, please bookmark my blog and use it directly. Last night I was surfing my links and noticed that there are several sites that take the whole post and my readers with it. I have nothing against sharing, but stealing the whole post king of sucks. So bookmark me or give me a click. Thanks.
GL trading.
I think gold is going to top temporarily this week.

E - minis 60 m - Battle with top trendlines continues. See that yellow box? That is the 50 to 61% retracement zone and it runs nicely with the 1062 support and the lower (blue) P2 support line.

DXY 60m - Is it in a descending triangle? HERE is one of my big questions. If the minis are in a 2 down bouncing off of strong resistance it appears it will take a 3 (third wave) up to bust that. Do you see a three driver in the dollar chart? It is at support and wedging. The floor in the dollar has me a little timid in calling for a impulsive 3 up. Does the market and the dollar begin their dislocation soon?

SPX chart - The style is called Sunset and I will use this weekly chart to call the sun setting one the SPX. We're missing the divergence in CCI and a larger divergence in RSI IMO.

SPX 60m - Looks like a completed 5 waves up, and the divergences are there. 1081 to 1061 is the target range at this time. That will be refined as we go.

Index comparison chart - Art mentioned the Russell 2000 this am and stole my thunder. Can you say lag?

SPX daily - Day 7 in the blue box - Look for MACD hist to turn today (I thought it would turn yesterday.
UPDATES -
UNG - Pulling back. 60m chart looks bad, but the dailys look ok for now. Be careful and set your stops.
EUR/JPY- Should drive down to support at 131.
EUR/USD -Between support and resistance topping.
Gold - I think it is going to have a small pullback very soon. I'll do a post.
Oil - forming a base for a further push higher IMO.
Look for updates during the day.
If you are reading this post on another feed, please bookmark my blog and use it directly. Last night I was surfing my links and noticed that there are several sites that take the whole post and my readers with it. I have nothing against sharing, but stealing the whole post king of sucks. So bookmark me or give me a click. Thanks.
GL trading.
Tuesday, November 17, 2009
E- minis, SPX And DXY Now
5 does not quite equal one yet (somewhere around 1115) but you can see the the resistance above and the lower ED trendline to the right - The retracement area is 1069 to 1058. If you look closely you'll see a red support line at 1062 and the lower dark blue P2 support line at 1060. divergence in S Sto and RSI are there. MACD as well. Let's pay close attention to what happens here. I believe this is A of either 2 or 4. If not it is 4 of 5 of 1. I am very leery (as I was Friday) of upside and remain only 50% short. When that trendline on the 15m breaks I'll add shorts up to 100%. All charts are in my chartbook and you'll see them on a 20m delay. Use the chartbook dropdown box to navigate.

15m SPX - If that lower black trendline gives way . . . . . backtest of the blue trendline for 2 or 4 of 5? Maybe to gap support?


15m SPX - If that lower black trendline gives way . . . . . backtest of the blue trendline for 2 or 4 of 5? Maybe to gap support?

DXY - Breaking out?

Looks like some sort of breakdown may be ready, BUT if that dollar reverses and a breakout happens look out. Keep those stops tight if you are short. I'll note that there is a possibility of one more pop up to 1115 SPX.
Morning Post
Indicators are almost there. 1035 SPX is a new number I am looking at for a top in the last week of December. 1121 is still my target.

/ES Daily - RSI needs to turn here or the divergence to price is screwed. Gray is upper bear market TL that was violated yesterday. Pink is the gap that got closed yesterday. So, at upper TL with dailys and weeklys ready to turn. Sounds like a good brew. How's that dollar doing?

$DXY daily - At upper bear market TL (pink). in a nice falling wedge setting new nt lows. Sky blue rectangle is a gap. RSI and MACD have a nice divergence to price and S Sto looks to be wanting to bull cross. The 60m is in a channel and is at the top of the channel right now. How does this fit with SPX?

SPX daily - Well, if you follow the trend of the 7 to 9 days for a top then we've had 6 days in the blue box. RSI cracked an intermediate upper trendline, but I think that will be corrected. The only worry for the bears IMO is if RSI and MACD decide to run all the way to their divergence lines. S Sto is embedding. I expect the MACD hist to reverse and start falling some today.

SPX 60m - Looks like a massive divergence to price is being set on RSI. Bear cross on S Sto.

SPX weekly - This chart deserves it's own post and it will get it with a monthly chart later today when I make my case for more upside. Notice the 1135 target point and the A-E rising wedge possibility (I'm not letting go of that quite yet).
Time for either wave 2 or 4 of 5 of C to begin soon. 1170 to 1161 for the target. I am still holding my 50% SRS and SDS and ready to add to them now. I suffered yesterday, but have confidence in a reversal here especially based on the minis and the dollar. IF the dollar cracks that pink trendline I may be inclined to call a top - BUT here is my big secret - I'm gonna bet on a backtest of that TL to set the ultimate top.
UPDATES -
EUR/JPY has busted a triangle and is headed to a lower TL at 131.
EUR/USD is about to puke all over its self at an upper TL and about to fall out of a wedge.
Gold - floor keeps getting set. I'm waiting on a pullback to add aggressiviely.
UNG - see post from yesterday I'm in a 100% long position with a stop just below the lows.
UUP - Near lower channel line that it has been riding for some time. RSI has taken out its lower daily divergence TL and S Sto is not ready to cross.
Sorry for not replying to some comments and not getting a post up last night. I am coaching a 3rd and 4th grade B Ball team and last night was the first practice, so those practices may hinder some of my nightly posts.
I got to speak with Damon Vickers yesterday on the Alex Jones show. I Asked him about the impending top. The interview was excellent and I highly suggest you tune into the replay around 10:00 est. I am on at 11:00. Really good interview. www.infowars.com
GL Trading.
Monday, November 16, 2009
Morning Post
Good morning. Still struggling with where we are. This is really tough spot.

e-mini 60m - The Gray line is the bear market top line. The pink line is the 1107 to 1109 gap. The royal blue lines are the rising P2 wedge. THE MINIS ARE AT THE INTERSECTION of blue and gray. The count?All I can say is that I believe we are somewhere in 5 of C of P2. I have speculated all along that it would truncate, but maybe not. We'll just have to see.

DXY 60m - Channeling down. I adjusted it from Friday, but it fits better now. At support of the 50% channel line and the 74.95 lows. The pink line is the dominant top trendline for the fall. $74.50 is a number I like. I'll be watching that pink line closely for a break.

SPX daily - If trend holds, it is still topping (see blue boxes). The indicators are all over the place. I have a sell signal (red line and I am still in a 50% position short in SDS and SRS from /ES 1097 level. The gap between RSI and the upper divergence trendline (black) bothers me as a bear. If that trendline gives way, all the top callers can go back to the drawing boards IMO.
With this being opex week, where the indicators are and where some prices are in relation to their trendlines, the markets are not offering us much help in defining a clear direction at this point. There is potential to go in either direction based on what I see. That may sound crappy, but if you are a ST trader, wouldn't you much rather know where we are headed instead of guessing? I'm still holding my shorts (and my breath). That intersection on the minis may be a very significant point, so no calls till that hits and we see the reaction. This could be a three here today as 2 or 4 of 5 may have played out. I have speculated that it would take a 3 to get thru those top lines and the gap. It is tough to call and I'm not willing to walk that ledge with where everything is.
Thursday, November 12, 2009
Morning Post
OK, I feel a little better this morning. Let's settle into this 2 or 4 of 5 of C and get this over with. Jobs gave a little pop to futures that were down a little that was immediately taken back. The WMT miss was toally ignored. There may be some pent up demand for either side after the last two days of low volume, or it may just be a lame week with fireworks next week. I hate Steve Liesman. He reminds me of the dude that played Frankenstein in Young Frankenstein, but just not as likable.

E-mini 60m - This chart shows the wave 4 down (green), the first leg of 5 up (yellow) and the breakdown that is either 2 or 4 of 5 of C up. The 1073 38% retracement appears to be a good target at this time for when it turns assuming the NT top is in.

Daily SPX chart - this is the key chart to me. Still a little room to run. Just a little unless something pushes hard and the indicators embed. I expect a red sell line to show up here today or tomorrow. Back to back dojis at a backtest of the C wave lower trendline. Any further upside will be halted near the 1114 upper BB for now. I do not expect it to get there. RSI is flat (again) and should (for the bear case) stop at the divergence line above. This is a great set up for a massive fall sooner than later.

INDU daily -See, I can look at other indexes. See the divergence lines on the indicators? For the bear case hopefully this is a ceiling and INDU turns right here or near here to keep the daily divergences in tact. I added back the BD line (cause hotoptionbabe.com has it).

SPX 30m chart - This is a good drilldown showing recent action. It is best compared to the e-mini chart above. Notice the massive divergences in each indicator.

TNX v. SPX - This may be a tell of an impending top as these two are now headed in different directions as TNX heads south. See pink box.

DXY - Did DXY break out of its falling wedge only to form a larger channel south?
The VIX is not quite ready to turn even though it has busted out of its falling wedge. The VIX indicators are mixed. DXY is making a good move north and might finally be clear of the falling wedge, but is it in a channel down? It appears there is some more churning to do in the market before the turn. I see limited upside potential at this point and an impending turn south sooner than later if the divergences on the 30 and 60m hold and play out (barring some sort of screwy market actions -LOL, you know what I mean).Volume is dead either because of the holiday or everyone is staying dry leading into opex next week. If the market does not get a pop south soon then opex with either create a further overbought top or a pretty significant pullback.
GL trading.
Wednesday, November 11, 2009
Minis, Dollar, EUR And The Wedges
Interesting day as both the dollar and markets are up today on what appears should have been a healthy breakdown according to the trendlines. Maybe the PPT or the HFT bots saw it coming and intervened. The action is just screwy IMO.I should have titled this the sick possibility of more upside (wait till you get to the daily chart - ugh).

$DXY 60m - Broke to new lows and pops up to take out what I believe is a solid tendline. This one is a moving target and I could have the upper and lower trendline in different places, but this makes the most sense to me. The DAILY $DXY has a solid divergence in RSI to price and S Sto looks like it may want to help push up. This is the chart you can trust the least IMO.74.50 baby - if it stops and holds there, my nightmare below will not come true.

E- Mini 60m - OK, so this puppy broke down thru the lower trendline of the rising wedge. Ya'd think the two breakouts together would mean something. The moves actually correlate very well (except for the dollars action in pre-markets which is why we had the up and down moves this morning in rapid fashion). Something to note is the DAILY e-mini RSI is at its divergence trendline at 69 with Sto topping.

EUR/USD weekly - This chart is a little hard to read as it is a chopped up version of a 10 year chart. One thing is clear - the rising wedge and the horribly overbought weekly indicators. That pink line is a trendline that was market support going back to 2003. Nice resistance on the backtest I say. The fibs are off of the lows in '02. Looks like a divergence in RSI is being set, thus breakdown soon. EUR/JPY is boring and in a ascending triangle inside a rising channel with a bad looking RSI divergence to price.
 Daily SPX - now to the meat of the story -THE RETURN OF THE DAILY INDICATOR CHART (yeaaaaaaa!) that is still under construction. OK - lots to cover here. Kind of cool to see the upper bear market trendline (black) right above with divergences all over the map on a daily chart below. The gap from 1107 to 1109 is just above (pink). Nice! What is not cool is how uncomfortable I am with price action to the indicators these days. It is becoming very irrational IMO and that is why I am so uncomfortable. When things that normally make sense stop - somethin ain't right. Now here is where I go all screwball on you. See that C=A target? Well that is where the weekly 200ma lies right now as well. What about that 5=1 target? 1204? Dude? Dude, I know, I know. Hell, I got sick this morning when I mentioned 1180 as a possible target not to mention my upper target of 1121. I am NOT calling these, just merely pointing out the possibilities. They do not seem likely given the position of the dollar, the minis, the divergences and the IMO total dis-functionality of anything right now. Now do you see why I am struggling? It was hard enough to believe this thing could bottom in March with all the troubles or even make it to this point. (I won't mention the inverse head and shoulders target of 1355, OK?)
I'll post a weekly chart tomorrow. Bottom line is all along I have wanted a nice retracement to reset the lower trrendline so the market had a little more room to run higher and this last low (wave 4 of C IMO at this time) has set up for the 5 to run. Either I have a fever or have drunken too much of the manipulation cool aide (which has kept my calls better than most) . I'll reassess and grind over this for a while. Pure TA says toppy now. Not sure why I can't bite. Maybe I'll be back to normal tomorrow.
Oh, I got admitted into the ZeroHedge DARPA program today. LOL - I hope they don't see this shit - oops - I'm on there RSS - Hey you guys and girls - ignore this post please.
Comments and prayers are appreciated. Speaking of prayers, don't forget Vetran's Day.
Morning Post
It is a new day at Shanky's Blog. I have entered the world of Disqus which will hopefully bring in a few more comments and add to the site. I plan on monitoring the conversations as often as possible. It should be a big improvement.
FIRST - Please remember that today is Vetran's Day. This may be the most important holiday we have. Remember those that fight, fought and fought and died for us to have our freedom. I'll most likely have an enormous rant about how F'd up our country is tonight and how the assholes in DC and on Wall St have disgraced these fine folks and us.

The minis set a fresh new high overnight at 1102, so this fairy tale adventure looks to have more legs. Another possible top come and gone. That one was a better fake out than the last. I am looking at this next top as "the" top as far as EWT is concerned. I'll clarify that meaning I think EWT will miss it one more time. Not busting anyone's chops but EWI's (cause you can diss them here all day long if you like), those folks need to learn to read the indicators. When they top and set divergences, then the market will top not cause your count says so. Yes, they will have a valid count after the fact, but only after the fact. Having missed two tops now, Prechter calling a top months ago and being "the experts" I would expect them to have their tails tucked quite tightly between their legs right now.
There was a missing 5 up of C and we're there now. Sooo many targets, but the way I see it is if 5=1 then somewhere in the 1180 range ought to do it. At this time, since I have not gotten out the abacus and the protractor and put it under the microscope, I can't give a precise number. I'm sticking with my original upper end target of 1121 (which will be expanded). At this time I think we're in 3 of 5 of C of P2. REMEMBER, I use EWT after consulting the indicators and make EWT fit to what the charts say. I also mainly use it as a nomenclature that allows me to more accurately describe the markets positions.I think we pullback very soon and then shoot for the moon during opex week to the possible top. I'll call it when I think it happens.

/ES 60m - Nice wedge! Top blue line is the P2 top trendline. Top pink line is the gap from around 1107 to 1109. That light gray line just above is the bear market top trendline. I'd say this is a major roadblock if you ask me. that combined with the 60m indicators being over bought with a divergence on S Sto and RSI means time for a pullback soon. A pullback to the lower P2 support line is possible, but we'll look at that later.

SPX 60m chart - Backtesting the trendline with some toppy indicators. Is that Mr. Divergence beginning to show his face on the RSI? MACD HIST has its divergence going on and might want a bear cross soon. S Sto is embedded and will fall sooner than later. Remember the dailys are the key for me and they still have a little room to run. the 60m can embed for months if they like. This chart says a turn is coming soon. Let that divergence in RSI get set.

$DXY 60 m chart - DXY to new lows! I had 74.50 as a target, but would not be surprised to see it sub 70 by the end of next week. I told you yesterday the wedge was not right, but now I think it is. This will have a temporary bottom soon.
Cutting it short this am cause I was running late. I think we top today or tomorrow early and have a pullback befor the big push in opex next week. I'm not sure where the bots are getting the funds to drive the market now as QE is supposedly dead and POMO no longer exists (as far as we know). Remember, you are a passenger on this ship and Captain Ben and his first mate Timaaay are running the show. Insiders have been dumping and the computers control 70% of the trade. They will let it fall when they want it to, or something outside of their control will have to rip it away. Keep following the daily indicators to the tops and bottoms and you'll be fine.
I'll do a detailed post today with measurements on where I think it ends and when.
I wonder if that babe in the bikini will stop by today?
Check out the Disqus comments and leave one if you like.
GL trading
Tuesday, November 10, 2009
Subscribe to:
Posts (Atom)