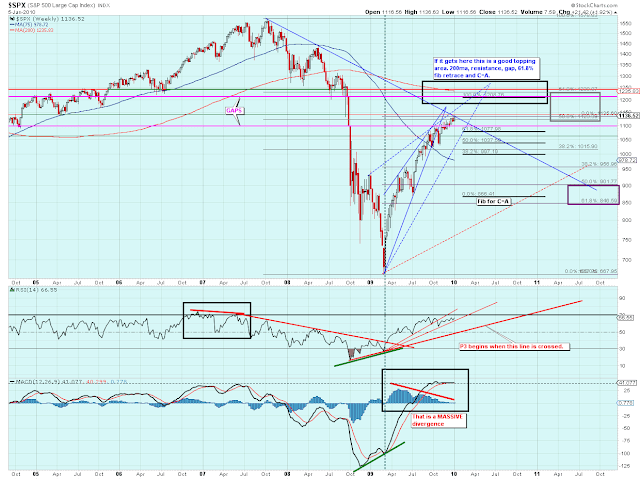
Why am I saying this now? Well the bear market top TL was finally struck yesterday by the SPX (others have blown thru this point previously). The lovely rising wedge with overbought indicators finally struck what one would think would be a logical turning point. Don't count on it just yet. We need more time. With QE 2 coming and congress apparently willing to raise the debt ceiling to whatever level the current administration desires, who gives a shit what happens down the road as long as the current market continues to levitate.
It will come crashing down very hard when it lets go, but as long as monetization and the cary trade are in force bears will continue to be frustrated. Yes, none of this makes sense. Well, it does if you are into the manipulation trade and can place all your bets denying anything that is rational in your mind. It is nuts, but you have to ride what they are giving you till it ends.
The end is coming soon the charts say so. Soon is a relative term when speaking in terms of time - soon in this statement means some months but less than a year for sure. I'm getting close to committing to a target, just can't pull the trigger yet. I actually don't want to, but it is part of the game we chartists play, so I have to.
The only chart that really bothers me as a bear is the monthly chart. I'm not sure how to read this 9 month bull market on it cause nothing is supposed to happen this fast. It looks very bullish. One thing for sure, and is more accurate, would be the weekly chart. To me there is a clear trend in RSI and the crossing of the lower TL will mark the end of all of this mess. Trust the charts. The charts say (I actually say) this P2 mess will end by or before July. Of course we have seen some pretty technical aberrations this year. I would not be surprised to see them defy the weekly RSI as well, but I don't think this charade can go on much longer. The "external" factor that I have called for all along, since the beginning, will occur. It will be a global event that will take down the house of cards. So, be patient and be ready.
Above I speculated July based on weekly RSI not piercing 70 by much. April looks better based on the larger wedge target. I like the April thru July window and my target for a top may be in that range or before. If you notice the P2 support line under RSI runs to 90 in October in the chart below. That is the worst case scenario for the bears and it fits well with the monthly indicators and what they may need to do to top out. The prior divergence in RSI that had me excited is all but gone. What the heck happens to MACD from here is anyone's guess. Again, I'm not sure what to do with the monthly charts at this time. This chart does not show it, but we are in a possible diamond topping pattern and we're at the apex of the diamond now. I'm just mentioning that since it is a technical pattern in play, but I'm not selling it.
What Random Walk? It appears that the indexes on this monthly chart have all gotten on the same path. This IMO is more by design/forced than a natural event. When everyone (the government/GS) is buying everything to keep everything above absolute zero in a risk less environment, this is what you get. Some may say this is a natural progression off of an extreme low, I'm not saying that. Step up to the table and pick a card, any card, they all will be a winner courtesy of the Fed and your current administration.
Today should be interesting as I speculated yesterday we are ending a triangle/wedge formation and may be due for a corrective move soon. It is not guaranteed and goes against some of the other counts out there, but it is the way I see it. An overthrow of the wedge is possible.
GL out there.


