Economic Calendar - GDP at 8:30 (3.4%est - 3.2% actual), Chicago PMI at 9:30 (68) and Consumer Sentiment at 9:55 (71).
Earnings Calendar -
Pivot Points - Know 'em
E-minis Daily Chart - Pretty simple. the yellow lines are the giant wedge that have defined the bull corrective's run from the market lows. The green line is February support that has been busted. The blue line is March support that has been busted and is being backtested at this point. The purple line is March support line that has been busted and now retraced. The resistance at the conjunction of the backtest of the March support and the upper bull run's top line should be a formidable spot to get thru (esp given the Greece and GS issues floating around). You can see how the market struggles (an how volatility really began) with the yellow resistance line. Well, here we are again. One of the most telling things to me that a turn may be in order was the divergence from price by the RSI. Those last couple of daily candles have eaten into that one large red candle. Looks like a small doji right now at resistance, but it is early. Also notice that small horizontal blue line at the top if the chart. that is the 61.8% retracement at 1234. Minis are flat at 8:52 am.

SPX 30m - By some EWT counts a 2 corrective has possibly been completed. This would be a major turning point. If so, a 3 should be impulsive and dramatic. If nothing impulsive and dramatic happens here, it is quite possible the march north will continue. The 30m chart looks ready to turn. Any weakness and it shoudl give a sell signal today. It is a little early with RSI not hitting the top sell line yet which has me concerned as a bear. Keep an eye on this chart in the chartbook as I will update it there during the day and post it here if a sell signal comes. (I will be out between 11 and 1). What is interesting is the 60m is sort of toppy as well. The standard is usually for a melt up and embed on the 60m, so I'm in hold my breath mode right now. Interesting point is at the black arrow at the triangle apex right now, sometimes those can be trigger points.

Good luck and have a great weekend!
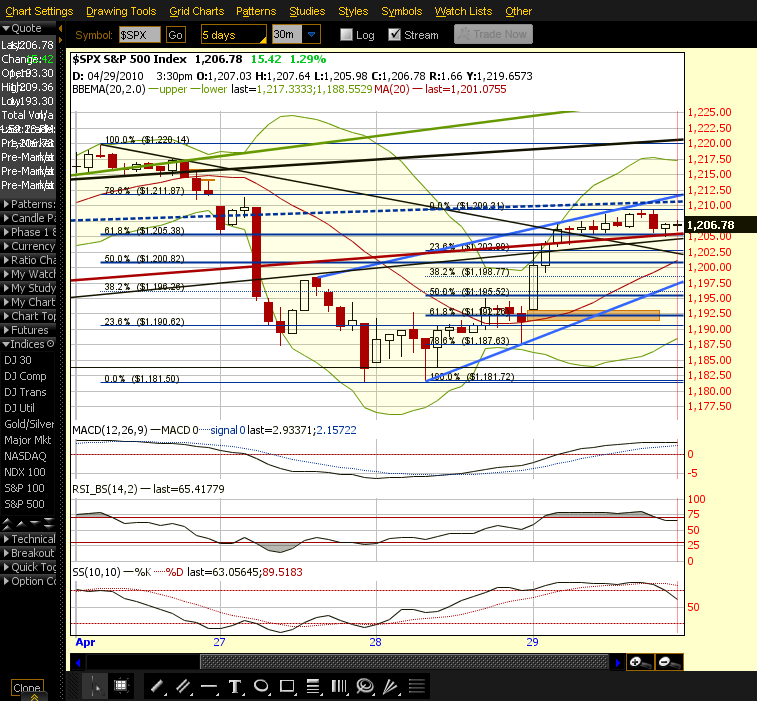
UPDATE: Here is an updated SPX chart from the post I did yesterday. Notice the interaction with the various S/R lines and where we are in relation the the SPX bull corrective's top TL (Blue Dashed). Possible wedge forming (blue) that says this may only be ending A of the corrective and we get drawn out till next to know where we really are (unless it breaks north of course). If this plays out look for a fall to 1197 for B then a grind up to possibly the 1217 area for C and then for the 60 and 30m charts to set divergences. I like this call a lot.