Thursday, February 26, 2009

AFLAC's Breakout Today


AFL had a classic breakout today from a falling wedge. Unfortunately it threw in a big gap and then it pulled back off its highs as the day went on. Unfortunately the market does not want to appear to want to cooperate and help AFL extend this run up. The market is in a throw to bottom out using wave 5 to make the possible final push to new lows.


I believe AFL will fight like a tiger, but will fail to the southern momentum of the market. AFL will need to fill that gap and possibly put in a back test of the channel or complete a dead cat bounce and put in the double bottom.

For those of you that do not know this stock, it is a powerful wonderful thing to have in a portfolio. One of the top 25 performing stocks of all time. The retracement zone will get covered, and I believe this one will recover faster than the general market. Even though it is an insurance stock and gets lumped with the rest of the bad boys in the index, it is a powerful earner that will make its earnings. I began accumulating at the 15.50 level and will add on any further weakness. I fully expect a double out of this one before the year is over. Just be careful near term.

Wednesday, February 25, 2009

Dr. VIX is in the house


Well, the uber bears are not going to like what I am about to write. Nor does this fit with the market breaking support and setting mew lows. I do not like the scenario either, but it fits what I think needs to happen.
Let's cover that first. I am a believer that to get to the end of the market it will need a form of capitulation we have not seen yet. I also think this capitulation will need to be externally caused and no one will be ready for it. A BOOM shut the markets down crash that the charts won't predict. I also think the bounce off of this crash will be just as abrupt.
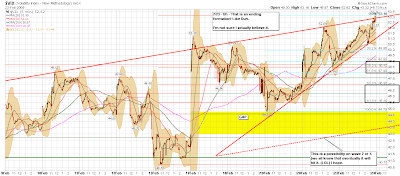
Now, IF (I said if, all of this is IF) the lower dominant blue trend line gives way (the one that it has been beating on basically all year) and the VIX goes after the lower gap wave 4 may become larger or at least more extended in time than we're all expecting. RSI and STO are also sitting on key support lines and headed south. MACD it is not overbought.
The red channel may become the dominant player in this game. I am ignoring the bull cross of the ema 10 over the bb 20ma and the 50 ema that are bullish signs. I am ignoring the symmetrical triangle formation that might break out to cover the gap at 71. Look at the bear pennant. See it? It is there. If this was a chart of the SPX we'd be falling all over ourselves proclaiming bear pennant and planning the next short move. Well, maybe it is the right time to short the VIX. What does it look like to you? If I do a wave count it is possible that this is near the beginning of a 5th wave down or we're in an ABC corrective before the next 5 wave structure down. I can count 'em any way I like. It is MY CHART! Oh yeah, and I can go back and change the count anytime I like. LOL
Bottom line is that things are dire, but the oversold conditions and apparent "value" that exists in the market might possibly be a driver. Ther are a lot of greedy people out there with tons of $$ on the sidelines. If this awful projection comes to pass I'm looking at the SPX 842 retrace. No, I have not been sniffing glue again. I like to look at "what if" scenarios and I'm simply laying this one out there. Go look at my other VIX charts for some more notes. S135 and other stocktockers, I'd love your take on this.
Bottom line is the blue trend line. If that cracks....
Comments are welcomed.
Good luck today.

Demise of DELL or will it "ring" the DELL?

With DELL earnings after the close on Thursday I thought I'd take a crack at this former bellwether to see if there is any life in this old dog. From the chart you can see DELL has not avoided the precipitous plummet that most equities have taken. Dell has held its value relatively well as compard to some others (really!). Being in the tech sector it has received some "dividends thru association" that it may not have deserved and the price may be artificially inflated.

Remember what happened to HPQ when they gave a bad forecast? Ouch to say the least, thus I believe DELL won't make the same mistake. Lenovo just got pummelled and I expect the same for DELL. One great point that was made on FastMoney after the close today was that DELL just does computers and that is it. No phones, MP3, no nothing other than computers and they are/have missed the boat. If they have the vid posted I'll add the link in the morning.

Here is the deal: You work for a company with 1,000 employees. They all have relatively new computers and there are a few hundred lying around. Well, they just laid off 200 people, so now there are another 200 workstations sitting idle. The company is starved for cash. Do you think they are gonna go upgrade the remaining 800 pc's to improve productivity? Add a bunch of new servers? How about the machine you are working on now. I'm sure it is good enough to get you thru another year till this mess is over. OR how about all those PS2's and Xbox players that are multiprocessors, they are taking market share as well. Dell's market is PC's and that's it. No one is buying them nor will they be.

Bottom line is I have included the historical support levels on the chart for a reason. Given market conditions (Uh...Wave 5 folks) and the economic environment, I don't see any way DELL can make earnings and announce enough job cuts to appease the market this quarter or next. I like to follow the earnings trough to the bottom of the market. Companies keep lowering and lowering estimates to a point where if you or I ran the company we could beat estimates. I am estimating that DELL is still at least 2 quarters from this point. Dell almost died a few years back and Michael had to come back to lead the company. I'm not sure is Steve Jobs announced he was moving to Dell if that would help.

Looking at he chart I have drawn a nice large blue falling wedge. Inside the wedge, conveniently approaching earnings, is a smaller black falling wedge. 17% from today's close is the support at $6.93 from 1997. I like this number sooner than later. I'm shying off from the $4.05 number now, but I do not believe it is out of the realm of possibility before this market ends. You see that "E" touch? It is down there for a reason. It should have one more touch of the bottom trend line, but it does not have to. The dashed red channel is a possibility for future contained movement after it leaves the wedge and begins to consolidate.

If DELL were to somehow surprise, can't believe I am even writing this, 38% retracement at $9.50 is all I am willing to give it. Again, I'll refer you to Lenovo and HPQ's performance and guidance. Maybe this latest black wedge down is it and the bad news is (gag) "priced in". That is very possible.

Play it as you will. Up or down. I do not recommend buying anything or speculating on earnings actions. I am extremely conservative. I prefer to miss the move and get it right after the fact, and I suggest you do the same. Profits are not as good, but the risk can be mitigated to a great degree.

Good luck today.

Tuesday, February 24, 2009

I'm Spent

No post tonight. Gonna catch up on some sleep. Guess my call for a reversal was not to bad. Sorry I did not believe in it more. Made about 11% on a small TNA play today and about 6% on a small SDS play. As for tomorrow. I think it runs a little more then I'll be looking to short again.

The case for a turn very soon (or not)


All charts are courtesy of http://www.stockcharts.com/


The case for a turn soon:


1) CPC Put Call ratio appears to be topping out

2) SPXA50 appears to be bottoming out

3) VIX wedge is ending

4) SPX (on my 60m chart not pictured) is bottoming out on a lt trend line and is also nearing the end of a falling wedge formation that is consolidating in the bottom of the funnel.

5) SPX has reached a perfect 1.68 wave length of wave 1.5 (if it is 3.5 and not still in 1.5)

6) SPX RIS 60m is in a sort of descending triangle that looks like it is running out of steam

7) The most consecutive down days in this bear market were 7. We just completed 6.

8) Oversold is an understatement (in some people's opinions)


The case against a turn is simple:


1) Until RSI turns above the dominant trend line we go lower.

2) Indicators across the board still look like crap.

3) The economy

4) The global Economy

5) Our banking system is broken

6) Did I mention the indicators would have to do a 180 for this market to turn?

7) The ema 10 has to cross the BB's 20ma before a turn can happen. They are not even close to each other.


I'm not advocating a turn to 1,000 SPX. Not even 850. I'm not sure it will make 800. I'm just saying a pause for the cause may be in order. Heck, a plummeting crash is in order actually. The conflicting signals are a little confusing. What looks good and what you want to see may not be real. I'll go with the indicators down for now, but not for long. The SPXA50 is just too oversold. Do you realize that on 01/01 there were 400 stocks in the S&P 500 over their 50ma's and now there are only 60ish? That is brutal.


Some of the lower targets I'm seeing for this fall (wave 5) range from 648 to the high 500's for SPX. We will throw in one more Zag upwards before then. Just when? Will it be wave 2 or 4. If this is 1 and 3 is the impulse kick ass wave we all better be loading up on canned goods. As for the ultimate bottom? Who knows when or where, but it will be this year.


Good luck today. Keep your powder dry and stops tight.


Monday, February 23, 2009

Mish on the Purposeful Joint Lie by the Treasury, Fed, FDIC

Mish has a great rebuttle to the joint announcement in his blog titled Purposeful Joint Lie by the Treasury, Fed, FDIC that is worth a read. He is a little more cynical than usual in this post. I would assume that he's getting a little fed up (get it - FED up) with the current administrations actions. I could not agree more.

Transparency has been preached and promissed, but that might not be what we are going to get. As you may have heard in Coughlin Stoia Geller Rudman & Robbins LLP Files Class Action Suit Against Bank of America Corporation: http://www.reuters.com/finance/stocks/keyDevelopments?symbol=BAC.N&timestamp=20090221002000&rpc=66
that Tahin can't or wont give testimony regarding the bonuses paid to ML executives. Also the Bloomberg suit regarding transparency is still hanging out there.

In the New york times article: In Latest Plan for Banks, U.S. Could Demand a Voting Stake
http://www.nytimes.com/2009/02/24/business/24bank.html?hp
you'll find what BS Mish is referring to in the "pixie dust" scenario of the truth.

Sunday, February 22, 2009

2/22 - Looks like we're headed up.


At this time futures are up close to 1% for the SPX. What will this week have in store for us? RSI and STO look to have bottomed and broken some long term down trend lines. MACD and ROC have to confirm. I believe (although unwarranted nor deservedly) the market will make a corrective bounce here as either EWT wave 2.5 or 4.5. The corrective waves are ABC formations that can drag out. I think this one will be quick and short with SPX topping at 808 or 827.
The EWTers are digesting where we are. Me, I have learned not to get caught up in making the imprecise counts (I add them as I see them though) and simply focus on the changes in direction these gurus can offer. I prefer to use the patterns as directional indicators and then let the waves fall in. If this is 2 or 4 who cares, just so we know we are going up to a specific range and then down again. I'll have a lot more concern when we know if this is 4.5 going to 5.5. At this time I see the market falling thru April which leads me to believe we're most likely beginning wave 2.5. This buys us some more time for 5 to play out, but it also gives us tremendous downside potential.
There is nothing that should move this market other than greed and some seeing value where it does not yet exist. Gold is intriguing even at these levels. If currencies begin to truly break down there is no telling how high it can get Fear is alive and well for good reason. Things suck and are not going to get better. China is not as well off as Cramer would have you think. We're not spending any money and are a ways away from getting out credit issues fixed. Don't forget that commercial RE has not taken it on the chin yet.
I like to use client calls as a barometer for when to buy and sell. The more buy calls I get the worse it usually is. I'm getting a lot of calls to buy. Not yet. They still can't believe me when I say not yet, but they have not believed me to this point.
This bounce should be brief. March is a big month and should be a real bear. The automakers deadline and the banking report come out. This will give us two huge barometers not to mention earnings for the quarter that will be dismal.
Stay bearish folks and don't get caught in the value trap. Keep your powder dry and stops tight. Good luck!

Weekly Calendar: Feb 23 - Feb 27 From Stocktock.com

Weekly Calendar: Feb 23 - Feb 27

Craig at www.stocktock.com does a great job posting this lisiting of events for the upcoming week. Take a look. It can help you out more than you think. Having knowledge of the days or weeks events has made me a better trader and allows me to gague my swing trades more selectively. While you are there look around the whole site. Lots of great info there.

Good luck this week.

LEGAL DISCLAIMER

LEGAL DISCLAIMER

Information related to market analysis on this website only serves as a general guide for possible short term market direction. The recommended ETFs are only general suggestions that are consistent with Shanky's Technical Analysis and Market Commentary’s short term view of the general stock market. They should not under any circumstances be taken as professional investment advice. All viewers should consult with registered financial advisors to make their investment decisions. In addition, the information on this website should not be used as the sole source in guiding one’s investment objectives. Investors should seek guidance from multiple sources before they make their investment decisions. Shanky's Technical Analysis and Market Commentary is not responsible for any investment actions taken by its viewers and will not be responsible for any losses incurred by such actions. Viewers who do not agree with these terms should not view this website.Information related to market analysis on this website only serves as a general guide for possible short term market direction. The recommended ETFs are only general suggestions that are consistent with Shanky's Technical Analysis and Market Commentary’s short term view of the general stock market. They should not under any circumstances be taken as professional investment advice. All viewers should consult with registered financial advisors to make their investment decisions. In addition, the information on this website should not be used as the sole source in guiding one’s investment objectives. Investors should seek guidance from multiple sources before they make their investment decisions. Shanky's Technical Analysis and Market Commentary is not responsible for any investment actions taken by its viewers and will not be responsible for any losses incurred by such actions. Viewers who do not agree with these terms should not view this website.

Saturday, February 21, 2009


Here is what I am looking at now. I've added a more concise drilled down 60m SPX chart. Not sure if the bottom is in or not for wave 5.3.5. I'm seeing extended 1.3.5 calls that are pretty scarry. Either way this is just another pennant forming before furhter moves south. Looking for a couple of more confirming indicators to make positive near term trend change is in and to determine the strength of this wave. We may not nail the bottom, but better than catching a falling knife. More updates to follow.

Friday, February 20, 2009

Thursday, February 19, 2009

FAZ and BGZ Crazyness.


The first chart is TNA 3x long. The second FAZ 3x short. FAZ may be unfair in this instance because of the financial mess, but it works for the purpose.

I thought I'd look into some of the 3x and 2x charts to see what they have to say about the market and if there may be some opportunity. The shorts are all showing signs of extreme bullishness. This type of pile on usually happens at bubble tops. Look at the volume candles on both charts. A high majority ocurred in the afternoon. These are some of the better equity indicators of extreme bear/bull ishness (and greed). One thing for sure is that those going into FAZ are not showing any signs of wanting to get out, and people are hauling ass to get out of TNA. The option chains for March are all over the place with some wild bets being placed. I mean all over the place. The fomations are rising and falling wedges that are both narrowing. FAZ's rose, fell and rose again this week once already, so I am not discounting another small pennant possibility.
At this time I'm not on either side of the trade as I am finding it frustrating as the market artificially levitates above where it should be and tests the lows. I am a perma bear. I know we are going lower, but I don't know when or how. Wave 5 is in progress. Is 3-5 ending or are the targets of 735 to 750 still valid?

I want to warn or remind that you'll get killed on any sudden reversal. Go look at my BGZ chart or SKF to see the pain that can be caused on the downside if you are not there to pull the plug. The bullish volume spike today in BGZ is incredible. Stops won't help you on a reversal at these levels, because it will not be orderly especially on a swing trade. Last one out turn off the lights.

If you hang out in these be careful and smart, not greedy. Pigs get slaughtered and this is the perfect vehicle for the slaughterhouse.


Obama - Are you listening?

Rick Santelli says it all. Just what you would like to say on national TV if you had the chance. Might have to change the name CNBS back to CNBC if they keep this up.

http://www.cnbc.com/id/15840232?video=1039849853

Wednesday, February 18, 2009

SPX 2/19/09

UPDATE: Dailys are still bearish so I (along with the all-seeing S135) see this as being a brief pressure release to the 800 or 808 area. However, there is a channel ine on my $$ G SPX - 60 min - 6 Months that is intriguing. That might take us to the 50% retrace off the 875 top around SPX 827 which would give us the gap fill (key word might). I’m keeping my eye on this move, but the charts will tell us what to do.

Flirting with disaster. Wave 3 of 5 down is in progress and why the market is not just falling off a cliff is confusing. All the elements were there chartwise and with the economy. How 3 plays out is anyones guess. We need to get lower for 3 to be longer than 1 (although that is not required). We reaced my first target of 780, but most are looking for something in the 735 to 750 range. Looking at the VIX the daily confirms further move south, but the 60m appears to want to turn up. This will cause another pennant on the way down and screw up a bunch of EWT counts.
Bearish case on the 60m chart above there is a possible bullish MACD cross, STO is about to give a bull cross witht the 10 ema, RSI is traveling along the 30/bottoming line, there is an enormous gap above and the market has sold off more than 10% since 2/9. The bear case is that everything globally sucks, the stimulus plan is a dud, housing market is not going to get fixed anytime soon, banks are possibly getting nationalized and on the TA side the sym triangle is ending in a pattern that should send it south and while traveling down a channel line beating on it repeatedly it will eventually give away.
My call - I am going against the tend. We may fall to the 750 level, but we'll rebound. With OpEx Friday the market may try to save SPX's max pain at 850. This has not been reliable over the past several months. The 60m charts look oversold and the market needs to let off some pressure. To me the volume is not there to take the market significantly lower, and I also believe that it will take some external stimulus to get the capitulation selling some are calling for. Any move up will be brief and will stop belos 875 SPX and really should not exceed 850 if it even gets there.
Good luck today.

Predicting Crisis: Dr. Doom & the Black Swan

This is one of CNBS's better interviews. For a dose of reality watch and listen.

http://www.cnbc.com/id/15840232?video=1027496846

Very Important Read

http://globaleconomicanalysis.blogspot.com/2009/02/nationalization-train-has-left-station.html

Want to know about nationalization? Here's a great place to start.