The technical take for AA is quite bright actually looking at the daily and weekly charts below. This take is in contrast to the overall markets right now as the broader indexes are set up for near term failure. Keep this in mind if AA should have good news after the bell and you chase it.
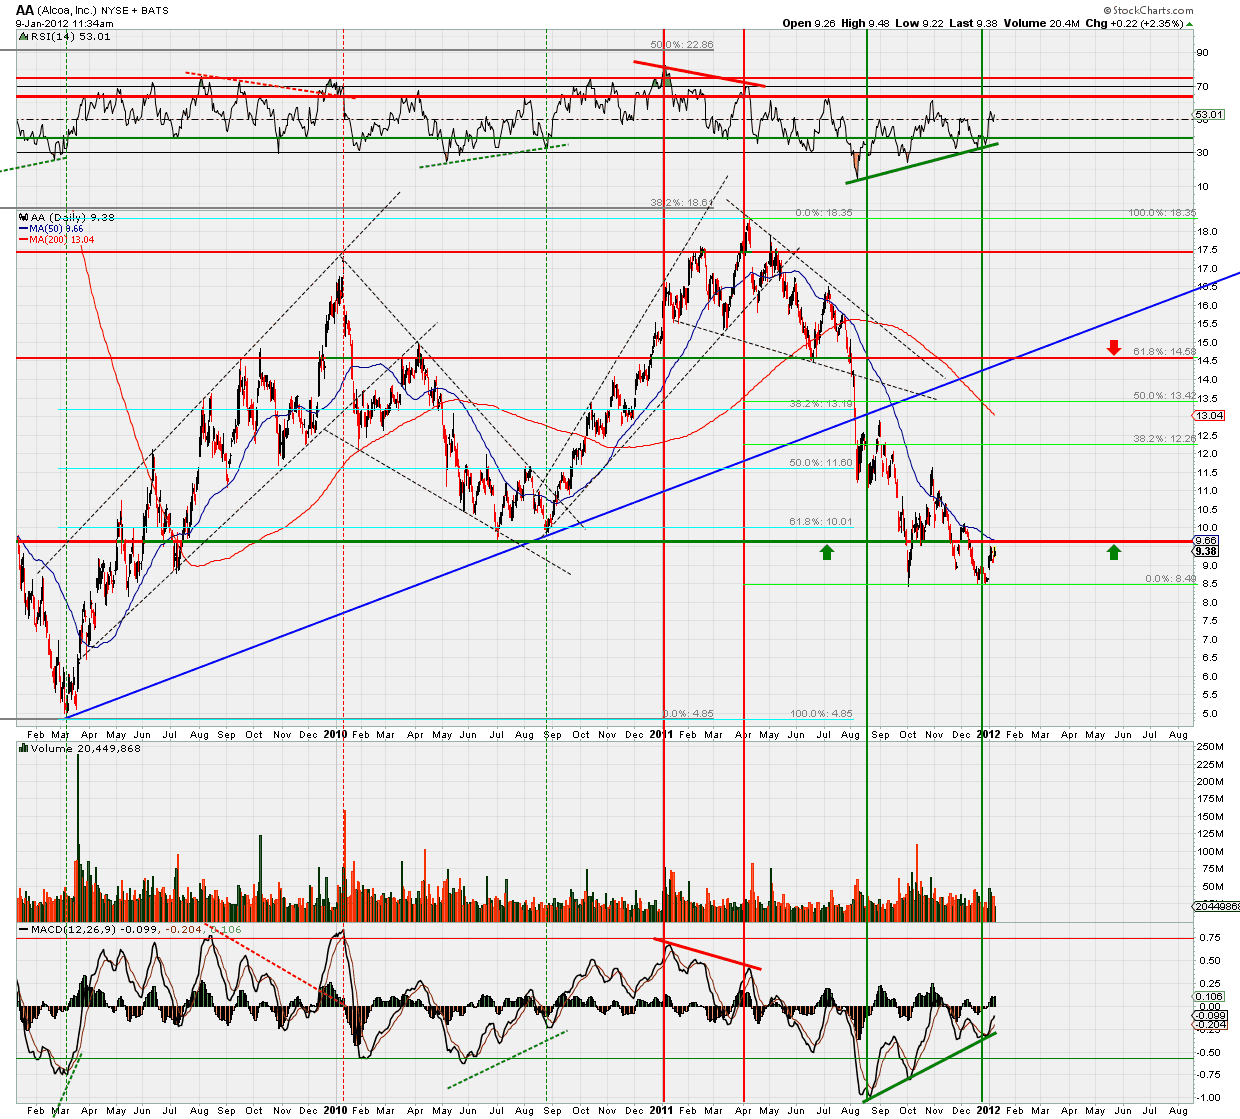
Daily AA - Quite the double bottom with strong buy divergences. No real patterns exist here. Price just simply violently fell into support near 9.60. The range (9-17) since the '08 fall and recovery is clear to see.
Weekly AA - Here the trading ranges are highlighted. The weekly chart has a small divergence that you saw on the daily chart. This says oversold. When the dailys and weeklys are working together that us usually a strong indicator some sort of pop should be coming. The weeklys DO NOT though have a positive divergence from the last major low (June '10) to this low. That is a sign that this price level is deserved and is not some sort of over emotional sell off.

Monthly AA - Dire? Oversold? Crushed? Some are looking at AA here and thinking they can print money buying at these levels. Well, short term there is a chance. Technically it looks like a pop may be in order, but as for some sort of ramp to former glory above $16 resistance- fuhgeddaboutit. Now a move to $16 would be prime, don't get me wrong. The monthly chart looks pretty ill and oversold but still has room for worse. Not as optimistic as the two charts above.

Now lets look at the INDU chart - AA is the first component listed alphabetically of course. Here is where my caution comes into play. AA is obviously one of the dogs of the DOW right now. The INDU has been setting higher highs in recent weeks and as an index is Compare AA's position close to the '08 lows and where the DOW is now. AA is weak and struggling to say the least compared to it's 29 brethren in the broader index. This is not good and I do not expect some sort of miraculous recovery for it to get in line with the rest.

Near term, obviously earnings are announced tonight, AA looks ready for a pop on the weekly and daily charts. What can it do? Well if news is good (doubtful for many reasons that I am not covering here - this is only a technical report) you should expect a decent pop but that may be short lived as the INDU chart indicates the index is overbought and giving sell signals. So, if news should be good, a buy may be in order, but that should be guarded and have stops under it, because it should be short lived.
GL and GB!
No comments:
Post a Comment
Keep it civil and respectful to others.